
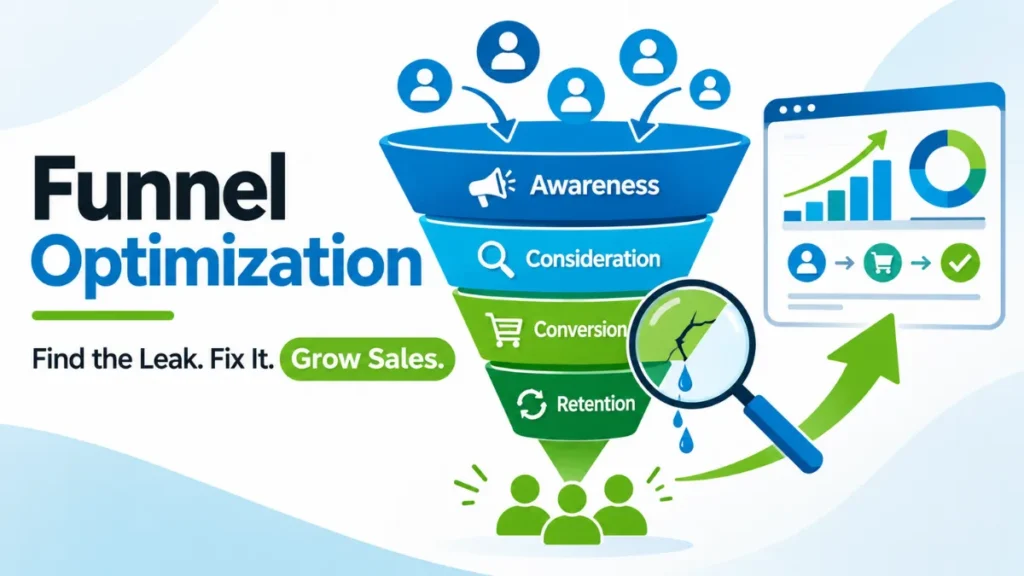
Funnel optimization means counting how many people move from one stage of your funnel to the next, finding the stage that loses the most sales, fixing one thing there and counting again. That is the whole job.
Most owners skip it. They see low sales and buy more ads. However, the leak often sits near the bottom, where a slow WhatsApp reply or a confusing quote loses the people you already paid to reach.
This guide walks you through six steps with one worked example from Sri Ganganagar. It shows you how to count WhatsApp enquiries and walk-ins for free. You need a Google Sheet and about an hour a week.
What is funnel optimization?
Funnel optimization is the repeating process of measuring each stage of your funnel, finding the biggest leak and fixing it. People call it conversion funnel optimization or marketing funnel optimization. The job stays the same: you move more people to the next stage without buying more traffic.
You need the stage names first. If they feel fuzzy, read how the four funnel stages work and come back. The short version is awareness, consideration, conversion and retention.
Funnel optimization also sits inside a bigger field called conversion rate optimization (CRO). CRO covers every page and button, and landing page optimization is one fix inside it. Funnel optimization takes the wider view and asks one question: which stage loses the most people?
Why fix your funnel before you buy more traffic?
Traffic costs money every time, while a fix keeps paying. The worked example below shows the gap. Doubling ad spend wins about 9 extra orders, but fixing the weakest stage wins about 6 with no extra spend.
Digital marketing makes this possible because you can track conversion rate, cost per lead and ROI for every campaign. A gut feeling becomes a number you can act on.
Step 1: Map your stages and count each one
Open a Google Sheet and write your four stages in a column. Then put one number next to each stage, using this table as a guide.
| Stage | What you count | Where you count it |
|---|---|---|
| Awareness | Visitors or people reached | Google Analytics 4, Instagram insights, Google Business Profile views |
| Consideration | Enquiries | WhatsApp messages, phone calls, website forms |
| Conversion | Quotes, bookings or orders | Your CRM or your sheet |
| Retention | Repeat orders and referrals | Your sheet |
Count offline leads too. Add one row per lead with the date, the source and the result. A walk-in at your shop counts as much as a click, and most funnel guides skip this step.
Do you have no funnel yet? Build the funnel first and run it for a month. The number you count depends on your funnel type. A booking funnel counts bookings, an order funnel counts orders and a walk-in funnel counts calls and direction taps.
Step 2: Calculate stage-to-stage conversion
This step is funnel analysis. You measure how many people reach each stage and how many move on. Use one formula for every stage.
Conversion rate = people at the next stage ÷ people at this stage × 100
The drop-off rate is 100 minus the conversion rate. For example, a 40% conversion rate means a 60% drop-off.
See it with real numbers. Say a furniture showroom in Sri Ganganagar counts last month. These numbers are illustrative, so use your own.
| Stage | People | Conversion from the stage above |
|---|---|---|
| Visitors (website, Instagram and Google profile) | 5,000 | Not applicable |
| Enquiries (WhatsApp, calls and forms) | 150 | 3.0% |
| Showroom visits with a quote | 60 | 40% |
| Orders | 9 | 15% |
Overall, 9 orders from 5,000 visitors gives 0.18%. That single number does not help you. The rate at each stage does.
No universal benchmark exists, because a furniture showroom and a tuition centre sell in different ways. So compare each stage with your own best month instead.
Step 3: Find and rank the leak
A leaking funnel rarely leaks everywhere. It leaks in one or two places. To find the worst one, ask a single question for each stage: how many extra orders would I win if this stage hit my best rate? Then carry those extra people down the funnel at today’s rates.
Say the showroom’s best month hit 3.5%, 55% and 25% at the three stages.
| Stage | Today | Best month | Extra orders if it hits the best rate |
|---|---|---|---|
| Visitors to enquiries | 3.0% | 3.5% | 1.5 |
| Enquiries to quotes | 40% | 55% | 3.4 |
| Quotes to orders | 15% | 25% | 6.0 |
Here is the math behind each row.
- Stage 1: 5,000 visitors × 0.5 points = 25 more enquiries. Then 25 × 40% × 15% = 1.5 orders.
- Stage 2: 150 enquiries × 15 points = 22.5 more quotes. Then 22.5 × 15% = 3.4 orders.
- Stage 3: 60 quotes × 10 points = 6 orders.
The quote-to-order stage is the leak, even though the top of the funnel looks biggest. Compare that with the usual fix. If the showroom doubles its traffic, it wins about 18 orders instead of 9, but it pays for twice the ads. Fixing the quote stage wins 6 extra orders at no extra ad cost.
Watch the handoff. Many small businesses lose leads at the point where the marketing funnel ends and the sales funnel starts. So check how fast your team replies to each enquiry before you blame the ads.
Step 4: Find out why people leave
Numbers tell you where people leave, but people tell you why. Use these three quick methods.
- Google Analytics 4 funnel exploration. It is free, and it shows where web visitors drop between steps.
- Microsoft Clarity or Hotjar. Both show recordings and heatmaps, so you see where visitors stall or tap in vain. Clarity is free.
- Five phone calls. Call five people who asked for a quote and did not buy. Ask one question: what stopped you?
Then run the WhatsApp test. Check the gap between each enquiry and your first reply for your last ten leads. If that gap runs past a few hours, you have found a leak. Buyers often message two or three shops at once, so the first helpful reply tends to win. This quick check works as a basic marketing funnel audit, and it costs nothing.
Step 5: Fix the leak, stage by stage
Start with the stage you ranked worst in Step 3, so this table shows the usual leak at each stage and a fix to try first.
| Stage | Typical leak | Fix to try first |
|---|---|---|
| Awareness | The wrong audience clicks your ads | Narrow the location and interest targeting |
| Consideration | A slow page or a vague offer | Rewrite the headline to state the offer, then trim the page (landing page optimization) |
| Conversion | A long form, a price surprise or a slow reply | Cut form fields, show a price range early and send an auto-reply |
| Retention | No follow-up after the sale | Send a WhatsApp reminder and a repeat offer |
Each fix belongs to a digital marketing pillar. SEO, social media and paid ads feed awareness. Content and email warm up consideration. Analytics keeps score at every stage.
Your funnel type changes the first fix. A booking funnel wins by shortening the booking form. An order funnel wins by cleaning up the checkout. A walk-in funnel wins by making calls and directions one tap away.
In the showroom example, the fix is simple. The team replies to every quote within one day and sends a WhatsApp follow-up on day three.
Step 6: Test one change and measure again
Change one thing, then wait four weeks. If you change the quote template, the price and the follow-up together, you cannot tell which one worked.
How you test depends on your traffic. If a page gets only a few hundred visitors a month, skip A/B testing, because the test needs more traffic than you have. Instead, compare the four weeks before your change with the four weeks after. If a page gets thousands of visitors a month, write a hypothesis first, then split traffic and run a proper funnel A/B test. Treat this as a practical rule, not a statistical one.
Log every change in your sheet with the date, the change and the result. After a few cycles, you hold a record of what works for your own customers.
Ecommerce funnel optimization: where Indian online stores leak
An ecommerce conversion funnel has more steps: product page view, add to cart, checkout start, payment attempt, payment success and delivery. Count each one and apply the same leak ranking from Step 3.
Indian stores often leak in four places.
- Payment failures. UPI and card payments fail at times, and many buyers never retry. Show a clear retry button and offer a second payment method.
- Cash on delivery (COD). COD lifts orders, but returns to origin (RTO) can eat the profit. Confirm every COD order on WhatsApp before you ship.
- Late pincode checks. A buyer who learns at checkout that you do not deliver to their pincode leaves annoyed. Put a pincode check on the product page.
- Long address forms. Typing on a phone is slow. Cut the fields and offer address autofill.
A 30-day funnel optimization plan
- Week 1: Count every stage and set up your sheet.
- Week 2: Rank the leaks and find the cause.
- Week 3: Make one fix.
- Week 4: Measure the result, record it and pick the next leak.
Common funnel optimization mistakes
- Fixing the top first. Fix the biggest leak instead.
- Changing five things at once. Change one.
- Ignoring offline leads. Log them in your sheet.
- Judging a change after three days. Wait four weeks.
- Copying another business’s benchmark. Compare with your own best month.
FAQ
What is funnel optimization?
Funnel optimization is the process of measuring how many people move through each stage of your funnel, finding the biggest leak and fixing it. You repeat the cycle to win more customers without buying more traffic.
How do you optimize a marketing funnel?
Count every stage, calculate the conversion rate between stages and rank the leaks. Then find the cause, fix one thing and measure again after four weeks.
How do you optimize a sales funnel?
Start with the handoff. Track the reply time for each enquiry, the share of enquiries that get a quote and the share of quotes that close. Then fix the weakest of the three.
How do you calculate funnel conversion rate?
Divide the people at the next stage by the people at the current stage, then multiply by 100. For example, 60 quotes from 150 enquiries gives 40%.
Which funnel stage should you fix first?
Fix the stage where a better rate wins the most extra orders. That stage often sits near the bottom of the funnel, and Step 3 shows you how to rank them.
What is the difference between funnel optimization and conversion rate optimization?
CRO improves the conversion rate of one page or action. Funnel optimization looks across every stage and picks the stage that matters most. CRO tactics then fix that stage.
Your takeaway
Count every stage, fix the biggest leak and measure again after four weeks. Open your sheet today and write down last month’s enquiries. Then check the reply time on your last ten. That one number often shows you your first leak.